
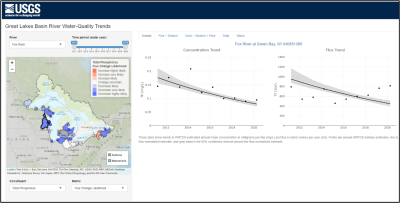
The United States Geological Survey (USGS) announces the availability of a new online, interactive water-quality dashboard for 24 major U.S. tributaries to the Great Lakes. The dashboard provides map and graphical displays of estimated loads and trends of phosphorus, nitrogen, and sediment for the period 2011 to 2020. This information is being used to evaluate ongoing progress toward the nutrient reduction goals of the GLRI and the Great Lakes Water Quality Agreement (GLWQA) with Canada. The dashboard will be regularly updated as new data become available.
This effort is jointly funded by the USGS National Groundwater and Streamflow Information Program and the GLRI. For any questions or technical assistance needs, please contact the USGS project lead, Matt Diebel (mdiebel@usgs.gov), or the USGS Great Lakes Program Coordinator, Jon Hortness (hortness@usgs.gov).