
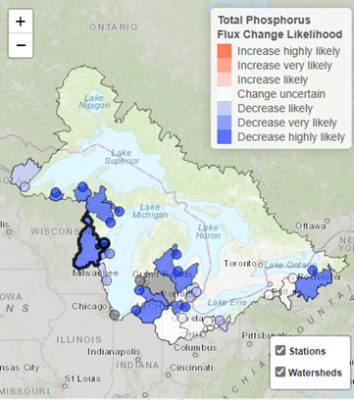
The United States Geological Survey has released an update of their interactive water quality dashboard for 24 major U.S. tributaries of the Great Lakes. The dashboard provides map and graphical displays of status and trends in water quality variables for the period 2011 to 2023. Updates to the dashboard include the addition of data through 2023 and the addition of chloride to the water quality variables, which also include phosphorus, nitrogen, and suspended sediment.
This information is being used to evaluate ongoing progress of nutrient reduction efforts to support Great Lakes Restoration Initiative objectives. The dashboard will be regularly updated as new data become available. USGS scientists collected the water quality data, conducted the analyses, and developed the dashboard that includes locations across from Minnesota, Wisconsin, Michigan, Indiana, Ohio, and New York.